
What Matters For Tight Ends In Fantasy Football 2026: Yards Per Game Stands Above All
Dwain McFarland breaks down what metrics matter most when predicting fantasy football success at the tight end position and how to leverage the data in your 2026 fantasy drafts.
Figuring out what data points and context matter for each fantasy position is one of my favorite parts of each offseason. While things may not change drastically from year to year, I am always researching new ideas and searching for emerging trends.
With that in mind, today we turn our attention to the tight end position.
We'll answer the following questions:
- Which stats best predict next-season performance?
- Does performance versus man and zone coverage matter?
- What does a league-winning TE look like?
- Is tight end playing time on the rise?
- Do personnel packages impact TE fantasy performance?
- How much does scheme matter for TEs?
- When do TEs peak and decline?
- Should we avoid TEs on bad passing teams?
This research serves as a baseline for my tight end tiers for the 2026 season.
If you are interested in this kind of research, we have already published pieces on the QB and RB positions, along with tiers for each.
- What Matters for QBs in Fantasy Football
- 2026 QB Tiers
- What Matters for RBs in Fantasy Football
- 2026 RB Tiers

Unlock Our Tools!
Stop hitting the paywall. FL+ gives you access to our premium in-depth content, expert rankings & projections, mock draft simulator, and all the tools you need – all personalized to your league.
Which Stats Matter Most for TEs in Fantasy Football?
We have our first position in this "What Matters" series where previous-season fantasy points per game (PPG) doesn't land the top honor.
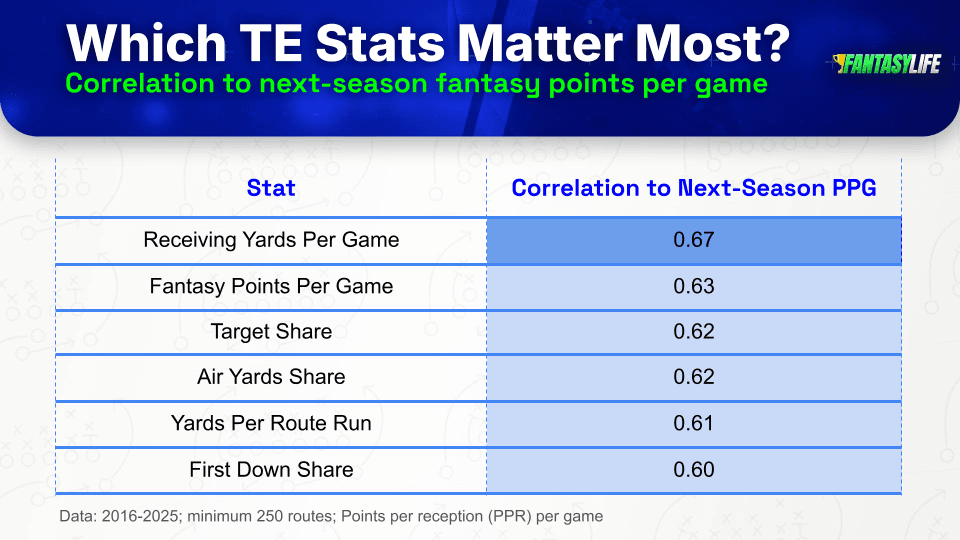
Receiving yards per game (YPG) comes in first. That might feel counterintuitive at first, but TE is a onesie position heavily influenced by touchdowns—and TDs are volatile, especially outside the elite tier.
Receiving TDs carry a 0.74 correlation with current-season PPG, but just 0.33 with next-season PPG. Year-over-year TD stability is weak (0.28). Meanwhile, receiving YPG is far more predictive, with a 0.65 year-over-year correlation.
The takeaway: Be cautious with TEs coming off TD spikes. Those seasons can inflate PPG and mask underlying usage. YPG is the more reliable baseline.
 Nerd Note: I didn’t include current-year fantasy football ADP in the table because I want to validate a new data source next season. Still, for the third straight position, it lagged behind prior-year PPG (0.55 correlation).
Fantasy PPG is closely followed by target and air yard earning ability—both essential for driving YPG. Yards per route run (YPRR) and first down share round out the top six.
There are two primary ways we can use these metrics.
First, we can use them to take a look under the hood of PPG and YPG. The engine is running, but what kind of condition is it in?
Historically, TEs averaging 50+ YPG post a 2.02 YPRR. Since 2016, 10 TEs have hit 50+ YPG with a YPRR of 1.70 or lower. Only 2 of those 10 repeated the following season. That’s your flashing warning light.
Second, per-route data—especially YPRR—helps identify part-time players who could earn larger roles. But this comes with risk.
Among 22 TEs with 40–60% route participation and a 1.50+ YPRR (top-12 threshold), 11 of 13 (85%) who played at least eight games the next season saw increased route share. However, only 54% improved their PPG.
Mark Andrews is the ceiling outcome: 6.7 PPG as a rookie to 13.9 in Year 2. In 2019, he appeared on 59% of ESPN playoff rosters and delivered 2.6 wins above replacement (WAR) as the TE15 in drafts.
Zach Ertz (9.1 → 11.5 PPG) and Dallas Goedert (9.9 → 10.6 PPG) offer more modest examples. Context matters—QB play and play-calling can swing outcomes—but in a vacuum, prioritizing younger players with Day 1 or Day 2 draft capital is a strong heuristic.
Dalton Kincaid fits that mold entering 2026: Round 1 pick, 2.79 YPRR in 2025, and just a 51% route share.
There’s one more angle tied to role stability: can underlying efficiency help identify which TEs keep high route participation?
When we isolate TEs with a 65%+ route share in the baseline season, YPRR jumps to second in predictive power (0.65 correlation with next-season PPG).
From 2015 to 2024, 113 TEs recorded a 75%+ route share. Of those, 85 played at least eight games the next season, and 58 repeated at 75%+. That’s a 68% retention rate.
To understand who sticks versus who falls off, we split them:
- Group A: Reached 75%+ route participation rate again the following season
- Group B: Fell below 65% route participation rate the following season
While route rates were similar in the baseline year, the underlying metrics tell a different story.
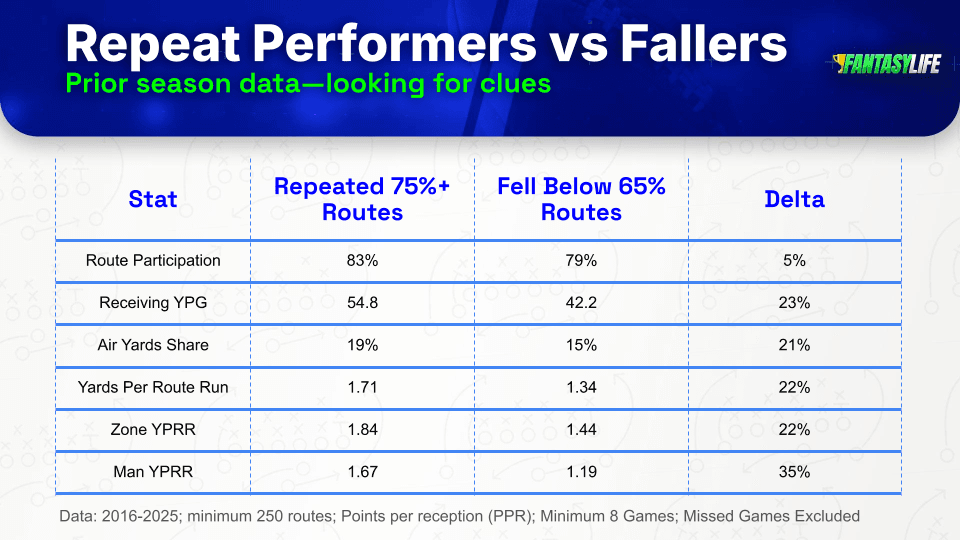
I only included metrics that shifted by 20% or more (excluding route participation, our anchor). The takeaway is simple: TEs who were more efficient with their routes were more likely to retain playing time.
Man coverage YPRR showed the biggest gap (35%). It isn’t strongly predictive—which is why this section is more about clues—but it’s notable. Winning against multiple coverage types logically supports sustained production, even if it didn’t crack the core metrics list.
For context, here’s the split between man and zone for targets and yards, along with ESPN Open Score.
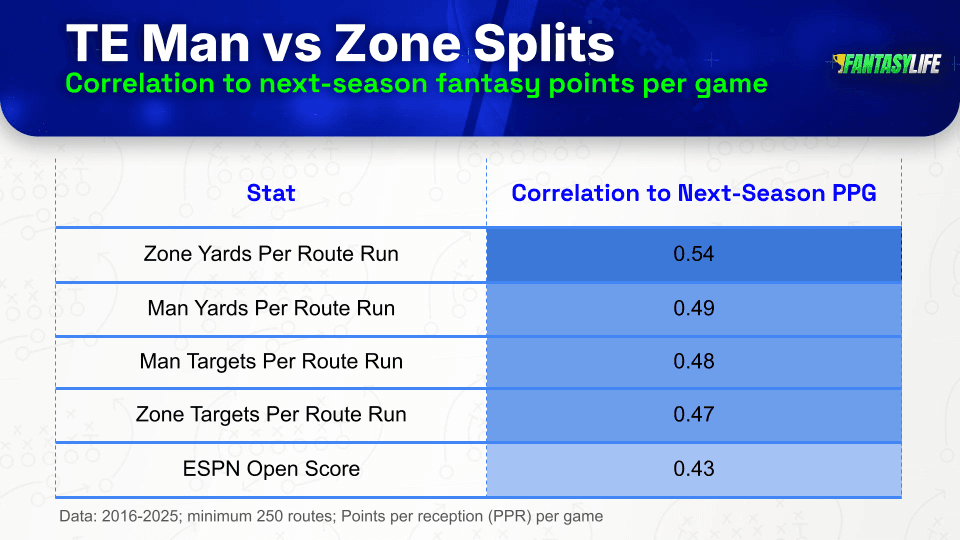
Zone YPRR ranking first isn’t surprising. NFL defenses use zone at nearly three times the rate of man, and TE aDOTs often sit shallow—creating consistent opportunities underneath.
These splits don’t carry the same signal as our primary sources, but they add useful context.
Top 15 PPG TEs from 2025 who crushed vs zone coverage:
- Dalton Kincaid: 3.67
- George Kittle: 2.56
- Tyler Warren: 2.20
What Do League-Winning TEs Look Like In Fantasy Football?
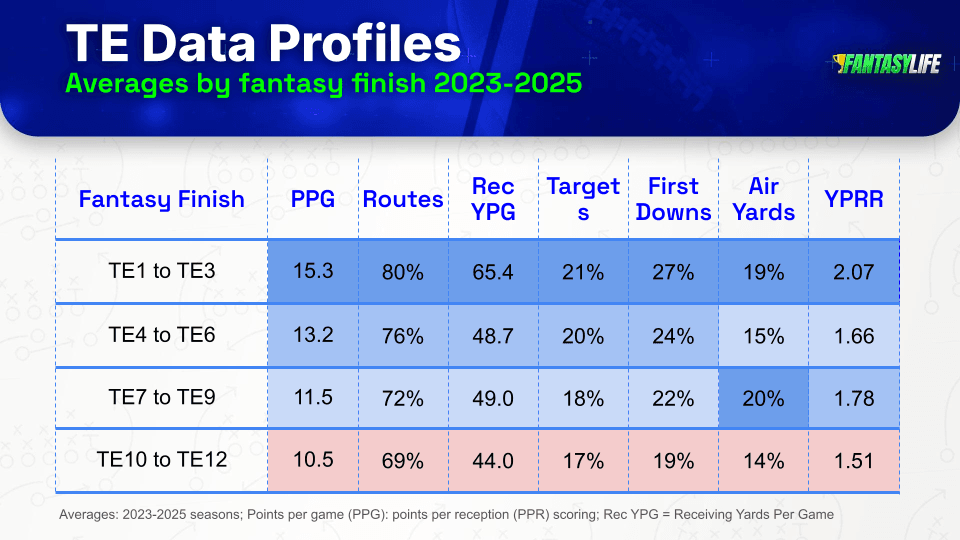
Let’s start with our top metrics and how they translate to outcomes, focusing on TE1–TE3.
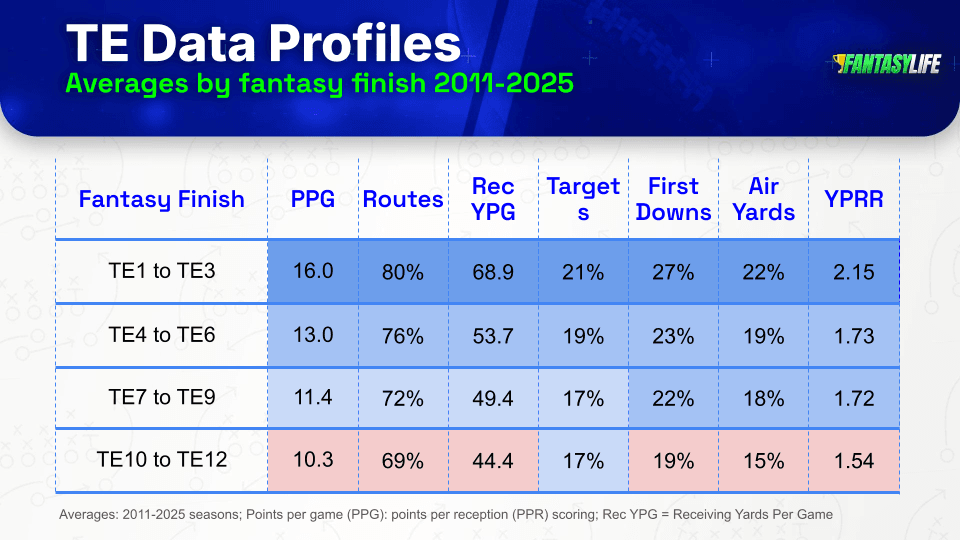
I expanded the sample to 2011 due to smaller TE cohorts, then layered in recent trends. Over the last 15 seasons, top-three TEs have averaged 16 PPG. Since 2015, 11 of 16 TEs who hit that mark appeared on 50%+ of ESPN playoff rosters—well above the 40% baseline. Three cleared 60%: Travis Kelce (72%, 2022; 61%, 2020) and Trey McBride (63%, 2025).
It’s tougher for TEs to reach league-winning rostership than RBs and WRs due to lower raw PPG. Since 2011, only Kelce (20.9, 2020) and Rob Gronkowski (20.7, 2011) have topped 20 PPG.
Recent context matters. Passing YPG has dipped, dragging down top-end outputs (along with the decline of Kelce and the retirement of Rob Gronkowski), while mid-tier buckets improved across several metrics.
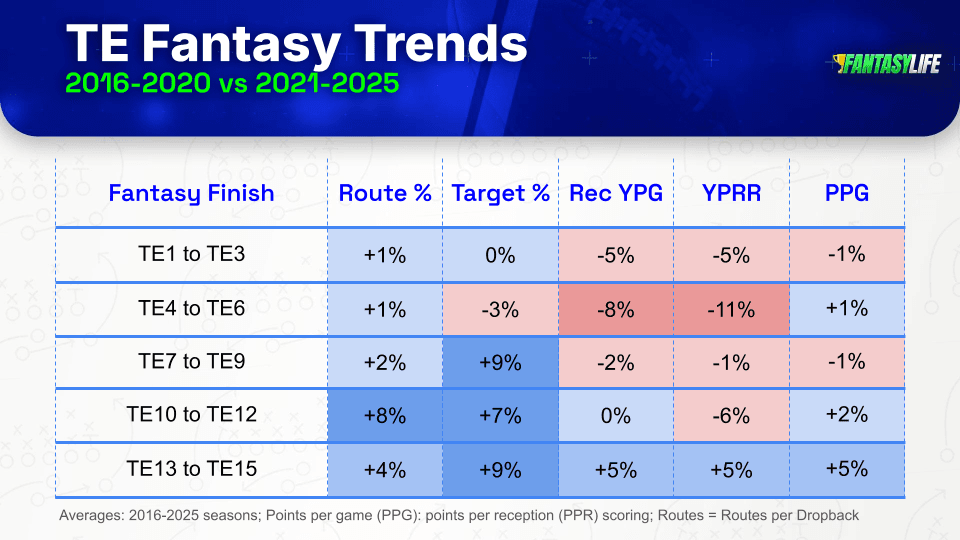
Splitting the last decade (2016–2020 vs. 2021–2025), routes per dropback are up across the board. The biggest gains show up in low-end TE1s and high-end TE2s, with both routes and targets climbing. Yards, however, are generally down—consistent with the league-wide passing dip.
This aligns with a broader shift: teams are using TEs more. TruMedia data shows 2025 hit highs in 12 personnel (16%) and 13 personnel (1.7%) usage.
That’s a mixed bag for fantasy. More TEs on the field doesn’t mean more difference-makers—most added volume won’t translate into lineup-worthy production. It also redistributes routes and targets away from WRs and RBs.

Still, there are ways some TEs can benefit from the shift. That brings us to personnel trends.
Does Personnel Matter for TEs in Fantasy Football?
The short answer is absolutely. Adding a second or third TE can create an advantage over a third WR—and this extends beyond multi-TE sets into all heavy personnel. The most common groupings:
- 12 Personnel: 1 RB, 2 TE (2 WR)
- 13 Personnel: 1 RB, 3 TE (1 WR)
- 21 Personnel: 2 RB, 1 TE (2 WR, second RB usually a fullback)
- 22 Personnel: 2 RB, 2 TE (1 WR)
Fewer WRs generally increase target probability since added players are often blockers. After 11 personnel surged from 2016–2024, defenses adapted, and offenses are countering. Sean McVay’s 2025 success with 13 personnel is one example. League-wide, heavy personnel hit 21.8% last season, the highest since 2015.
For the record, it probably won't work for many teams, but front offices spent draft capital at TE, and coaches have openly discussed playing more from under center to keep defenses off balance.
We will use data since 2019, because we also have access to ADP data back to that season in TruMedia. That will also allow us to examine how these groupings affected the top 100 TE picks.
But let's start with the league-wide view, where TEs saw a boost in YPRR and PPR points per route in heavy-personnel sets.
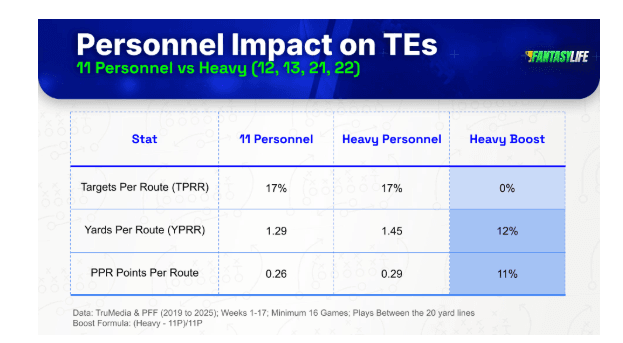
Note: Only data from between the 20-yard lines was used to avoid overinflating fantasy points near the goal line, where teams use heavier packages. Shorter fields can also depress YPRR. Finally, Week 18 was excluded to avoid the final week of the season, when players were resting or not playing the full game on some teams.
Now let's look at the same data for TEs taken in the top 100 picks in fantasy drafts since 2019.
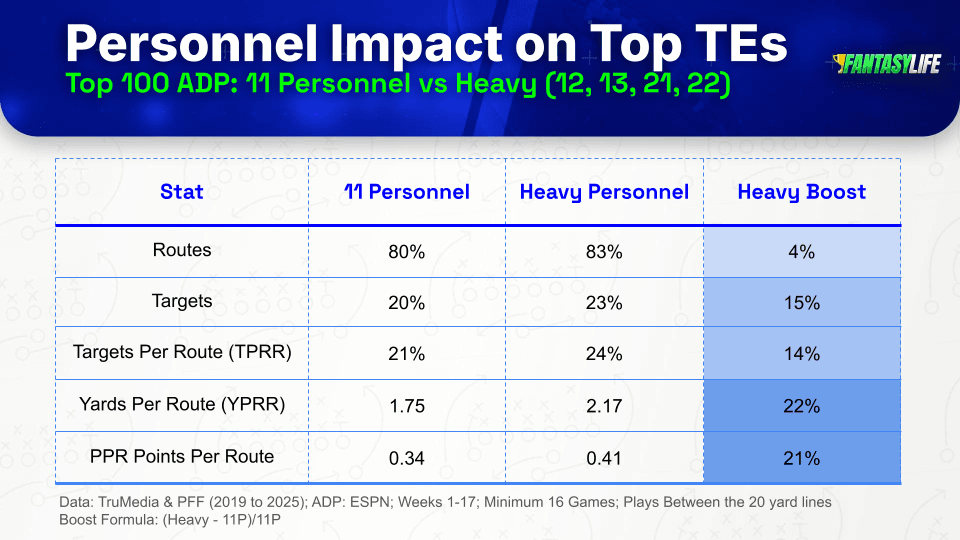
First, the advantages we saw for TEs at the league level carry over to the top-100 ADP options. Second, they saw higher route participation and target rates. That is a good combination for TE1s on heavy personnel teams.
Not all groupings are equal.
Some groupings assisted our top-100 ADP TEs more than others when it comes to routes, targets, and YPRR (same filters as above):
- 13 Personnel: 97%, 35%, 2.64 → 0.55 fantasy points per route
- 22 Personnel: 85%, 25%, 2.63 → 0.53
- 21 Personnel: 64%, 18%, 2.41 → 0.42
- 12 Personnel: 85%, 22%, 1.96 → 0.36
The biggest boosts come from 13 and 22 (one WR), but they’re rare (5% and 3% of plays between the 20s).
Top 13 personnel playcallers from 2025 (remember - using data from between the 20s):
- Sean McVay | Rams: 30% → Drafted Max Klare; Weak WR3-4; potential boost for Terrance Ferguson.
- Drew Petzing | Lions: 11% → From Cardinals; likely modest usage given roster, but any bump would help Sam LaPorta.
Top 22 personnel playcallers:
- Joe Brady | Bills: 12% → Lost FB Reggie Gilliam; three strong TEs, could shift toward 12/13; potential route bump for Kincaid.
Top 21 personnel playcallers:
League usage is lower (6%) due to FB scarcity. There are blocking requirements for TEs in this set, which can cap routes.
- Kyle Shanahan | 49ers: 38% → Status quo; George Kittle remains well positioned.
- Mike McDaniel | Chargers: 25% → From Dolphins; added FB Alex Ingold; also added TEs (Charlie Kolar and David Njoku); murky for Oronde Gadsden.
- Todd Monken | Browns: 19% → From Ravens; added FB Michael Burton; path for Harold Fannin Jr., but not a lock due to blocking. The Browns could also lean more into three-WR sets, given additions of KC Concepcion and Denzel Boston.
- Josh McDaniel | Patriots: 17% → Added FB Reggie Gilliam. Neutral for Hunter Henry.
- Klint Kubiak | Raiders: 15% → From Seahawks; added FB Connor Heyward; weak WR room; boost for Brock Bowers.
- Brian Fleury | Seahawks: Shanahan tree; two FBs and two strong TEs.
Top 12 personnel playcallers:
Most pervasive heavy package in 2025 (22) across the NFL. It comes with the lowest returns with two WRs and potentially a competent No. 2 TE, depending on the team. It has a small edge over 11 personnel for fantasy points per route, at 6% (0.36 vs. 0.34). But it comes with good route participation.
- Kevin Stefanski | Falcons: 41% → From the Browns, where the WR room was weak; added Austin Hooper; positive for Kyle Pitts.
- Zac Robinson | Buccaneers: 38% → From the Falcons; don't see a clear reason to use multi-TE sets; Cade Otton likely stuck battling three WRs often.
- Ben Johnson | Bears: 33% → DJ Moore is gone, leaving the WR depth weaker; good news for Colston Loveland.
- Matt LaFleur | Packers: 32% → WR turnover (Romeo Doubs and Dontayvion Wicks); boost for Tucker Kraft once healthy.
- Drew Petzing | Lions: 30% → Second appearance in personnel section; small bump for LaPorta routes.
- Zac Taylor | Bengals: 29% → Weak WR3/4; Erick All is a deep sleeper.
- Klint Kubiak | Raiders: 28% → Another plus for Brock Bowers; Michael Mayer also gets a small bump.
All of this feeds into my projections. Teams projected for the highest TE route rates:
- No. 1 → Rams
- No. 2 → Raiders
- No. 3 → Bears
Personnel is a key lever—but there are more.
How Much Does Scheme Matter For TEs in Fantasy Football?
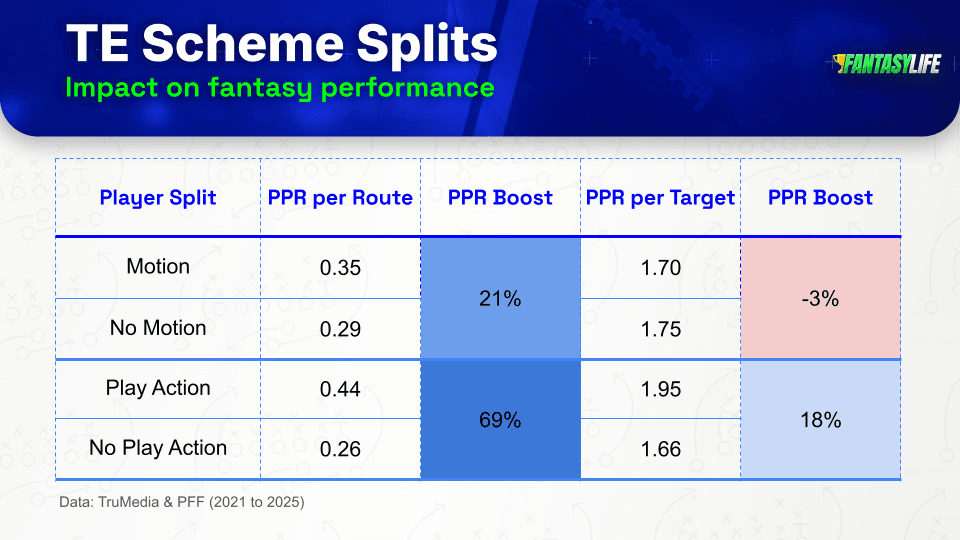
Play action and motion are two more cheat codes for TE scoring. Over the last five seasons, TEs have seen a 69% boost in fantasy points per route on play action and a 21% boost with motion.
Last season, Sean McVay, Mike McDaniel, Ben Johnson, Shane Steichen and Joe Brady ranked highly in both.
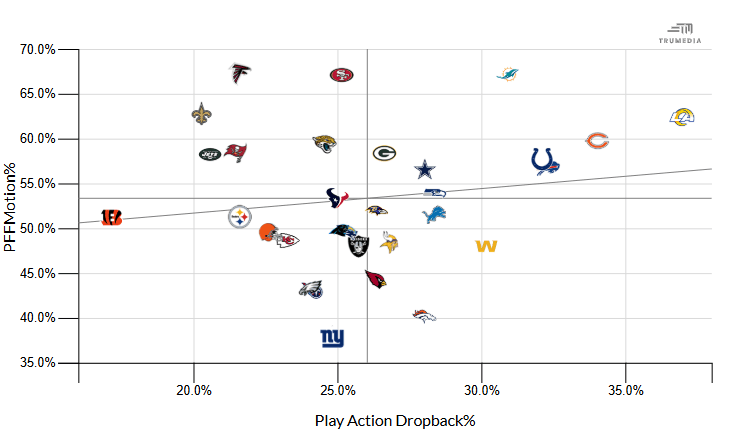
There’s also meaningful overlap with playcallers who lean into heavy personnel, reinforcing how these levers work together.
Quick player takeaways:
- Loveland checks another box.
- Tyler Warren gets on the board (and Michael Pittman Jr. is gone).
- Kincaid's name just keeps popping up.
- Bowers (see Seahawks) locks in another green check mark.
- There is so much potential with Terrance Ferguson as a sleeper.
- If Gadsden somehow earns snaps in heavier sets—or the team leans more 11—he could still deliver, but he’s tough to project.
- Jake Ferguson is in a crowded offense, but this is a positive.
- More Kraft propaganda.
- Kittle and LaPorta are in decent spots.
At What Age Do TEs Peak And Decline In Fantasy Football?
For this exercise, I compared each season of a TE’s career—bucketed by age—to their best three-year stretch (prime). This helps isolate true growth and decline without the noise of early ramp-up or late-career drop-off.
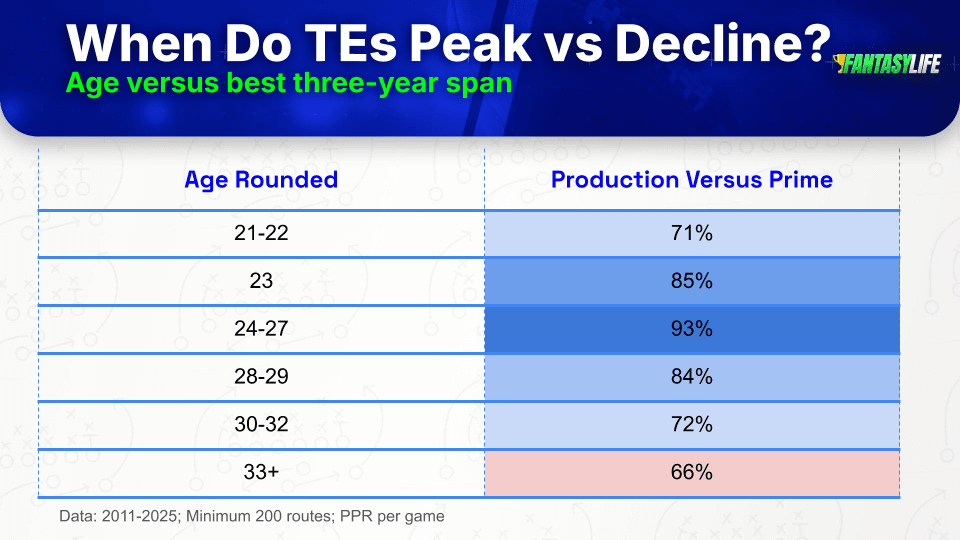
Key takeaways by age bucket:
- Pre-Prime: Ages 21-22. Historically slow starts, but some recent prospects have flashed earlier.
- Early Prime: Age 23. Clear progression toward peak efficiency and role.
- Prime: Ages 24-27. The sweet spot for top-end production.
- Late Prime: Ages 28-29. Still highly productive, with spike-season potential—especially for players who have already shown elite ceilings.
- Post-Prime: Ages 30–32. Production trends closer to pre-prime levels; decline typically sets in.
These are guidelines, not absolutes. Individual trajectory, offensive environment and target competition all matter. Some veterans can extend their window in the right situation.
Travis Kelce is the outlier. Fading him from ages 29–33 meant missing multiple league-winning seasons—he cleared 45% ESPN playoff rostership each year. Still, since 2011, Kelce and Delanie Walker are the only TEs over 30 to average 16+ PPG.
Should We Avoid TEs On Bad Passing Teams?
The key here is avoiding outliers. TEs rarely deliver top-six seasons in truly poor passing environments. Since 2011, it’s been extremely uncommon for a top-six TE to come from an offense averaging under 225 passing YPG.
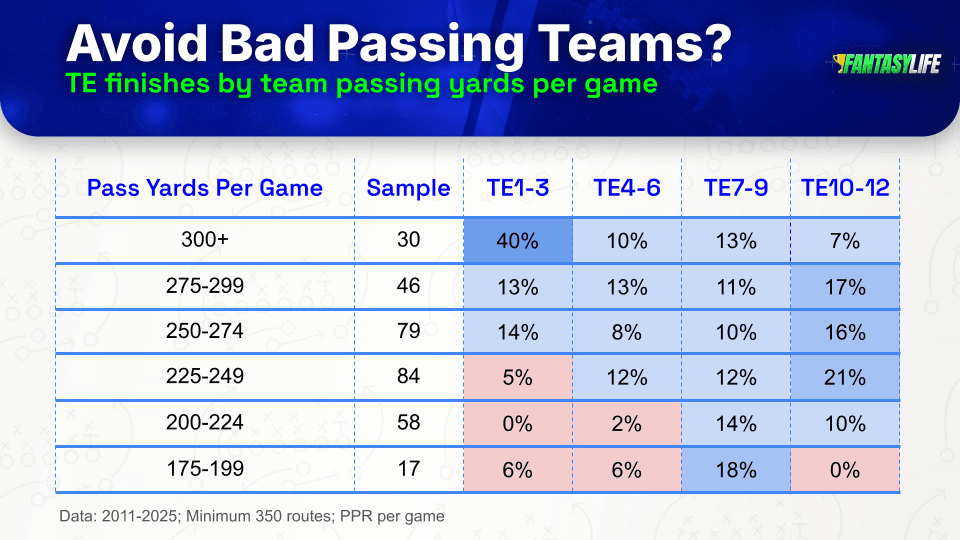
This is where ADP discipline matters. Harold Fannin Jr. fits the talent profile we want, but paying a top-three TE price on a Browns offense with real QB downside is risky. In the TE7–TE9 range, he becomes more viable—the hit rates flatten across passing environments, allowing us to bet on talent without overexposing ourselves.
Using a 2011–2025 sample gives us stability, but recent trends matter. Passing volume has dipped, and when we isolate the last 10 years, the buckets become less uniform. Part of that is sample size, but part of it is the evolution of the game.
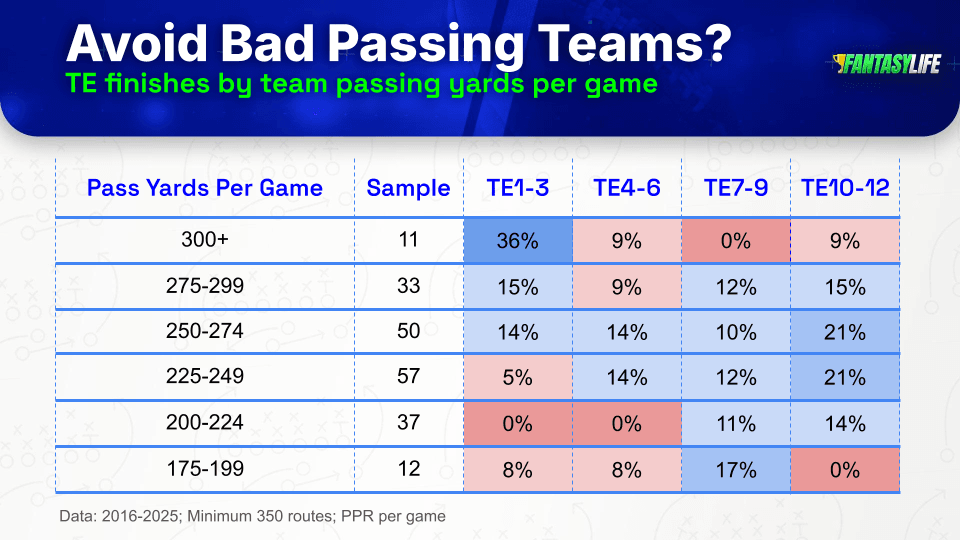
Notably, 300+ YPG offenses dropped from 30 teams in the full sample to just 11 in the trimmed one. The new ceiling is 275–299 YPG, with 250–274 still strong.
Bottom line: Elite TE outcomes still correlate with strong passing environments, and pricing needs to reflect that.
My lowest projected passing YPG for 2026:
- Dolphins: 192
- Panthers: 195
- Browns: 206
Highest projected:
- Cowboys: 263
- Lions: 261
- Bengals: 255
- Rams: 255

Join Our Newsletter
Trusted by 400,000+ fantasy football players. Get access to Fantasy Life's free award winning newsletter and tools, all in one step.
By registering or logging in, you agree to our Terms of Use and Privacy Policy.
Players Mentioned in this Article
Presented by








Published Updated